Smart Capital News
May 8, 2026
Smart Capital News
May 8, 2026
The multifamily housing market has reset more dramatically in the last 24 months than at any point since the post-GFC era. National apartment vacancy climbed from roughly 5.7% in early 2024 — the rate cited at the NorCal Multifamily Forum — to a record 7.3% in December 2025, according to Cotality. Cushman & Wakefield's Q1 2026 MarketBeat now puts the U.S. apartment vacancy rate at 9.4%, reflecting the absorption of a 38-year supply peak.
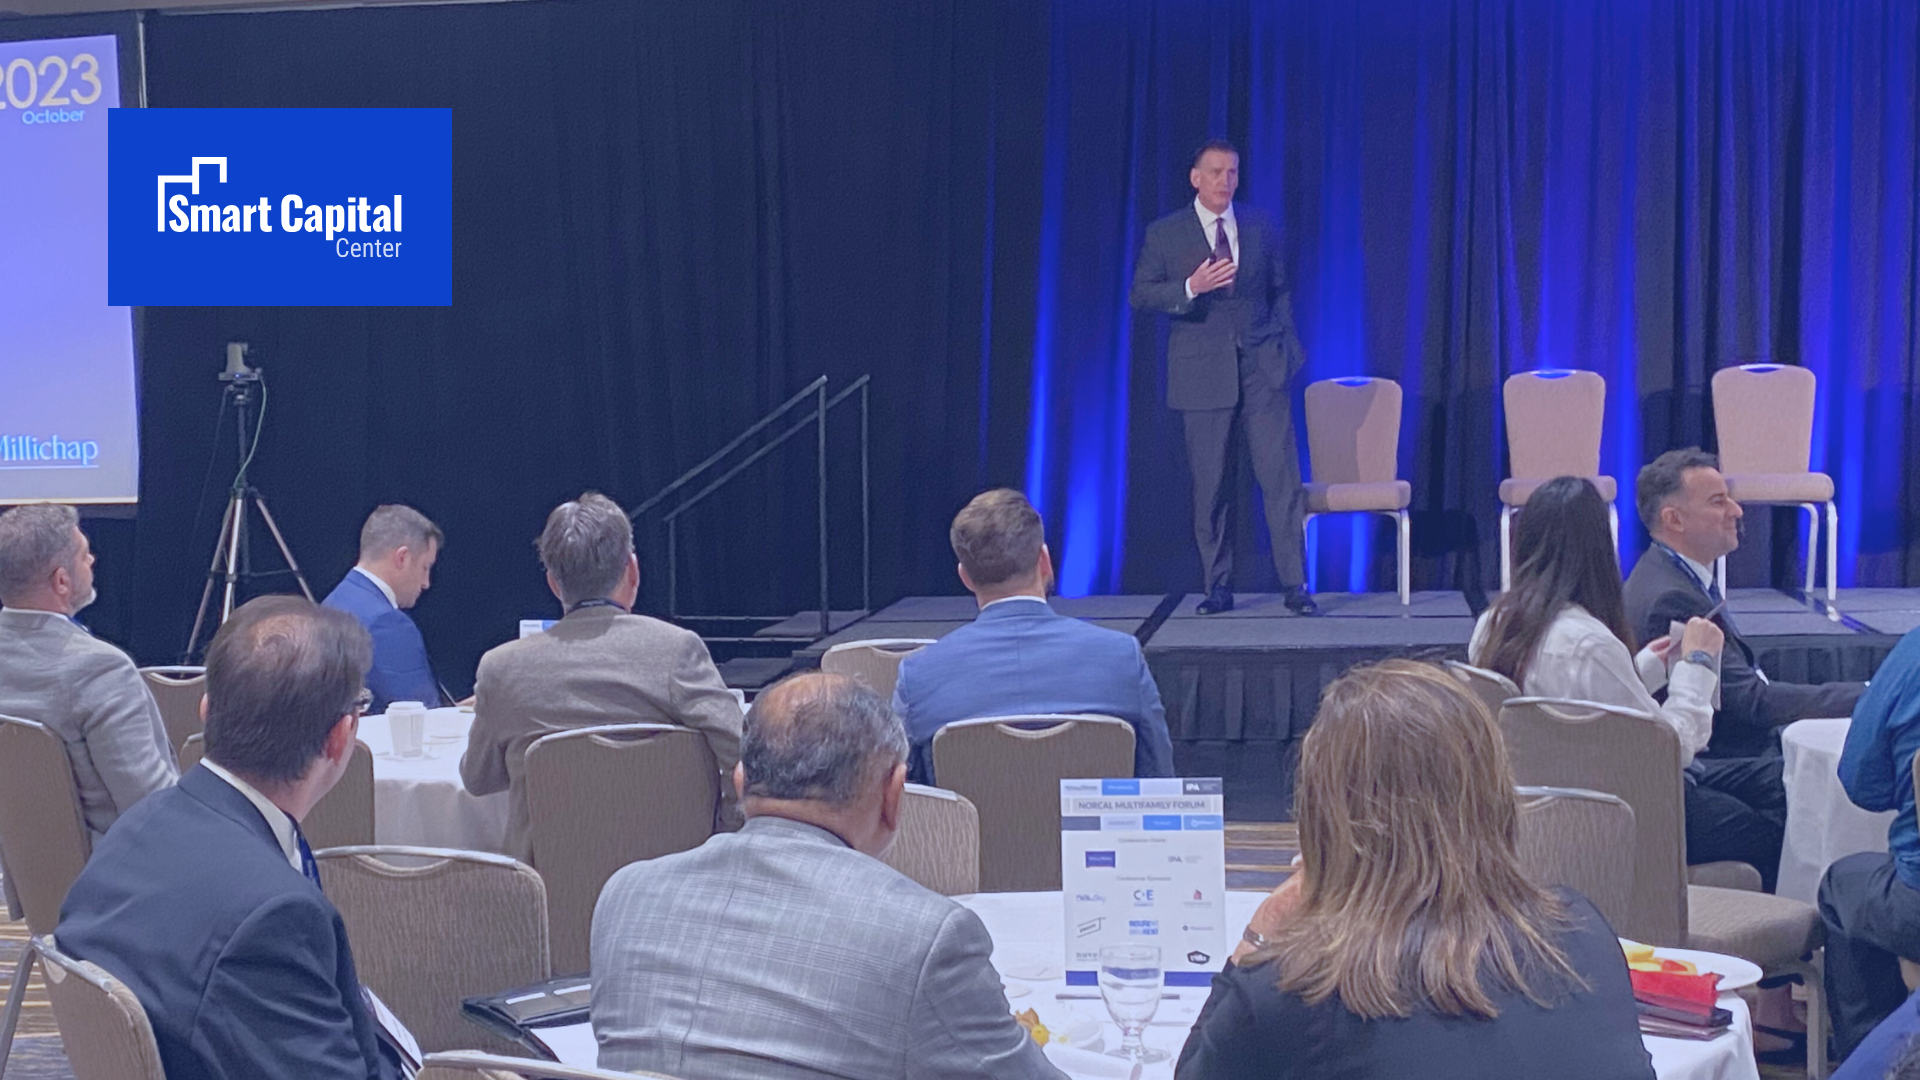
This article revisits the key themes John S. Sebree, SVP & National Director of Multifamily at Marcus & Millichap, presented at the NorCal Multifamily Forum — and updates each one with current 2026 data so investors and lenders can underwrite to today's market, not yesterday's narrative.
At the NorCal Forum, the conversation centered on dramatic geographic divergence in new supply. That divergence is now even more extreme. According to Apartment List's national rent data, 11 metros posted vacancy rates above 9% in early 2026, and five crossed 10%.
Sun Belt and Mountain West markets dominate the high-vacancy list: Cape Coral and Naples at 11.3%, Colorado Springs at 10.2%, Austin at 9.7%, San Antonio at 9.5%, Dallas–Fort Worth at 9.0%, and Boulder at 9.2%. Coastal and supply-constrained markets — including the Bay Area — sit on the opposite end of the spectrum, with vacancies near or below 5%.
Smart Capital Center benchmarks vacancy and rent trends across more than 120 million properties in real time, helping investors stress-test underwriting against current submarket data rather than stale national averages.
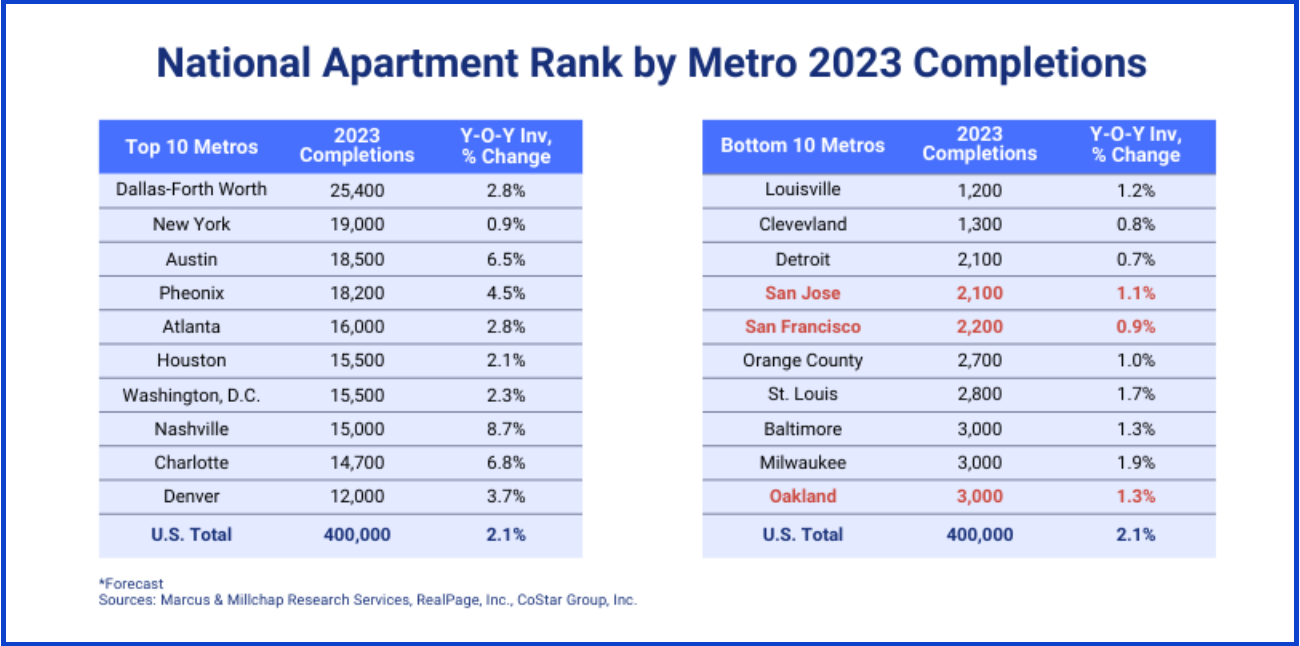
Attendees were prompted to consider the disparity in new unit deliveries across various markets. On one end, regions such as Dallas, Fort Worth, and New York are introducing a considerable number of new units. Yet these represent a smaller fraction of their existing market stock, with New York adding less than 1%. In stark contrast stand cities such as Austin, Charlotte, and Nashville, where the new units account for a significant 6.5%, 6.8%, and a striking 8.7% of their current market, respectively. This growth, especially in Nashville, can be seen as both impressive and somewhat concerning, suggesting a possible excess that could unsettle the balance of the market.
On the flip side, the right side of the table reveals those markets adding the fewest units, where the Bay Area stands out. Emerging from the pandemic, the Bay Area's recovery has been markedly slower compared to other regions. This slower pace is reflected in its construction numbers, with San Jose at 1.1%, San Francisco at 0.9%, and Oakland at 1.3% in their housing stock, respectively. These figures, while modest, indicate a cautious approach to development, which could be seen as a strategic advantage, mitigating the risk of oversupply.
The contrast between the two sides of the table also draws a line between the economic forces at play. Although Detroit and San Jose are very different - Detroit has a lower-income, Midwestern economy, while San Jose is high-income and on the West Coast - they both share a cautious attitude towards new housing developments.
A broader overview reveals that while a total of 400,000 units are being delivered nationally, over 45% of these are concentrated in the top metros on the left side. This concentration suggests that while development is active, it is not evenly spread across the country. Such a pattern indicates that certain markets are becoming increasingly dense with new developments, whereas others maintain a more cautious growth trajectory. The implications of these trends are profound, signaling the need for a nuanced understanding of local markets when navigating the multifamily real estate sector.
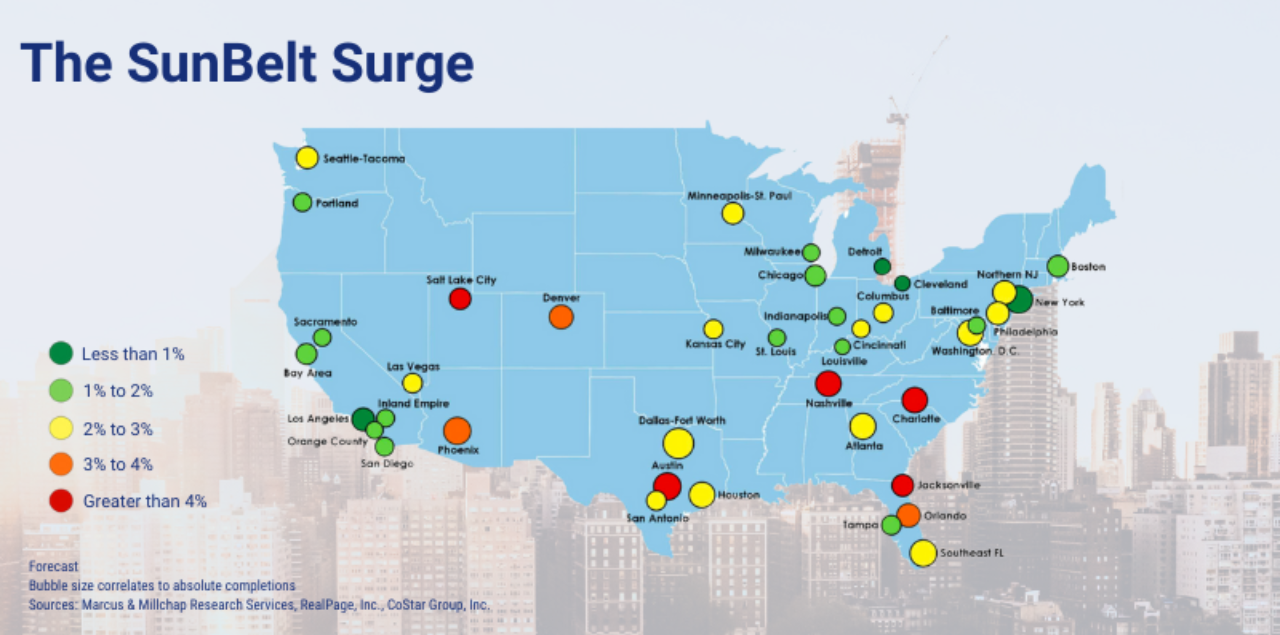
The pattern Sebree warned about at NorCal — concentrated overbuilding in Phoenix, Salt Lake City, Denver, Austin, and Nashville — has played out. According to Tactica RES analysis of ApartmentList data, every one of the 25 highest-vacancy metros in early 2026 is now posting negative year-over-year rent growth.
Permitting volume tells the same story. Dallas–Fort Worth issued 23,150 multifamily permits in 2024; Austin issued 15,126; Houston issued 11,505. With permitted units typically taking 18 to 30 months to deliver, much of that pipeline is still hitting the market into a softer demand environment.
The takeaway from the NorCal Forum still applies: less is more. Markets with regulatory or geographic supply constraints are now outperforming overbuilt Sun Belt metros on both rent growth and asset values.
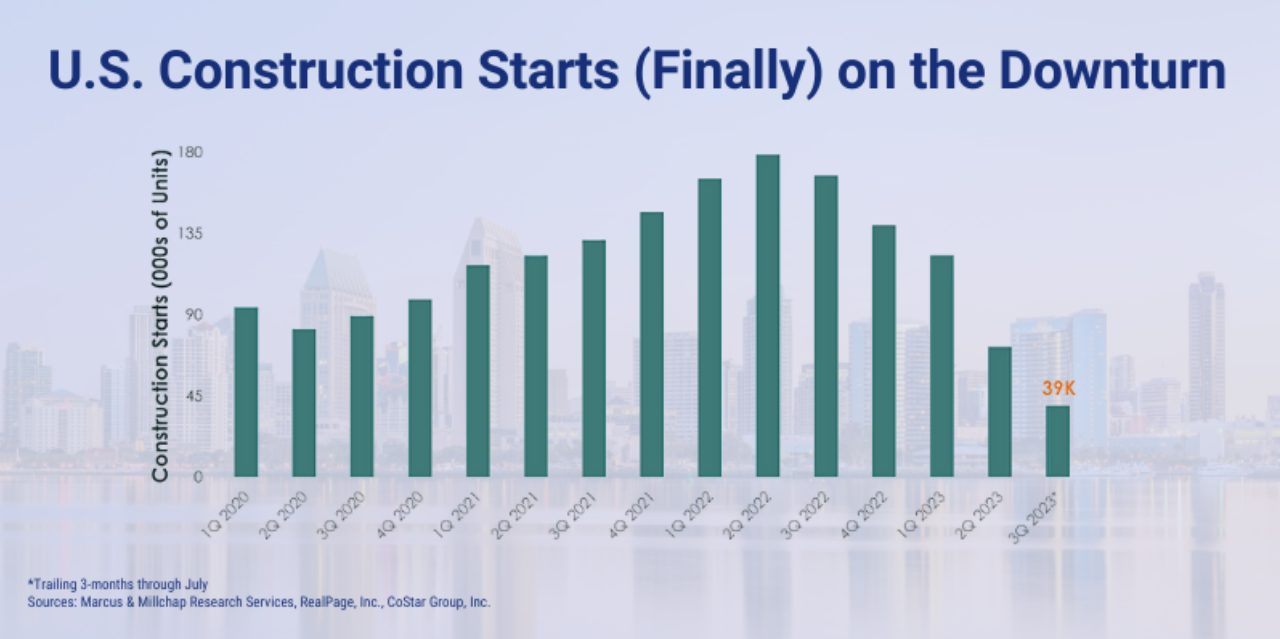
Multifamily starts peaked at 547,000 units in 2022, fell sharply to 355,000 in 2024, and are forecast at roughly 413,000 in 2025 — a modest rebound. NAHB projects starts will decline 5% in 2026 to 392,000 units and another 6% in 2027 to 367,000, leveling off near pre-pandemic norms.
"The multifamily market has slowed due to tighter financing and elevated construction costs and is moving towards a more constrained development environment. However, despite the pullback in starts, multifamily completions reached a 38-year high in 2024 with 608,000 units as projects initiated during the boom years were delivered to market." — Danushka Nanayakkara-Skillington, NAHB Assistant Vice President, Forecasting and Analysis
For investors, this matters: construction has dropped to its lowest level since 2016, according to Cushman & Wakefield's Q1 2026 report, which means the 2027–2028 vintage will be supply-starved. Markets that hold occupancy through 2026 are positioned to capture rent growth as the cycle turns.

The story in one line: The median age of U.S. rental housing is 45 years — the oldest on record — and elevated mortgage rates continue to push would-be buyers into the rental pool, per Harvard's 2026 America's Rental Housing report.
The gap between owning and renting has widened, not narrowed, since the NorCal Forum. The 2026 Joint Center for Housing Studies report at Harvard documents three forces compounding rental demand:
In the Bay Area, the gap is among the widest in the country: three Northern California metros consistently rank in the national top eight for cost-of-ownership premium. The implication for multifamily is unchanged from NorCal — sustained rental demand in supply-constrained coastal markets.
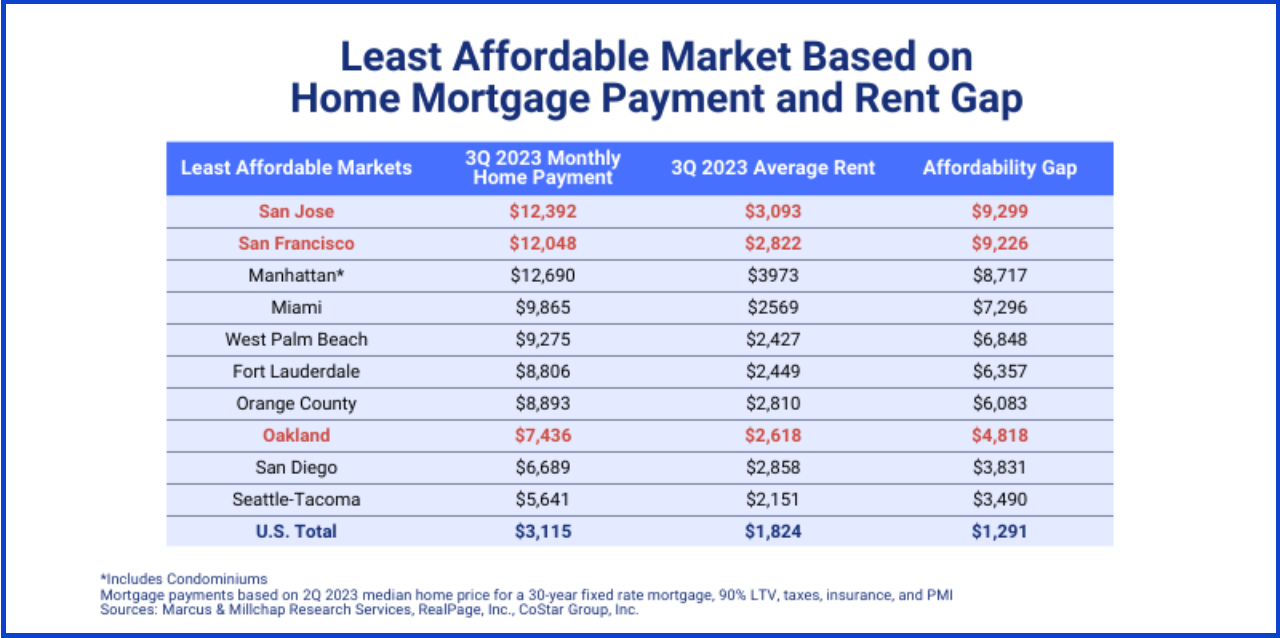
The story in one line: Affordability gaps are widest in coastal/AI-driven metros (Bay Area, Seattle, LA, San Diego, Miami) and narrowest in Midwest cities (Cincinnati, St. Louis, Cleveland) — and that gap is precisely what makes the high-cost metros structurally rental-dependent.
Top-tier coastal metros consistently rank highest on the cost-of-ownership-to-rent ratio, according to JCHS 2026 data and JLL Research benchmarks. Households earning the local median in San Francisco, San Jose, Los Angeles, San Diego, and the Miami MSA face owner premiums materially above the national average, which structurally enlarges the renter pool.
Midwest metros like Cincinnati, St. Louis, and Cleveland show the opposite profile: smaller affordability gaps, higher homeownership conversion, and softer rental demand growth. The lifestyle and economic trade-offs are real — coastal markets carry higher absolute costs but also higher household income and job density.
Takeaway: Multifamily fundamentals are strongest where homeownership is least achievable. Coastal supply constraint plus an unaffordable for-sale market is the durable demand engine.

The "wall of maturities" discussion that dominated the Forum has only grown in scale. After roughly $1.0 trillion in CRE loans matured in 2025, total maturities through 2026 are projected to exceed $1.5 trillion, with some estimates as high as $1.8 trillion.
Multifamily is now the dominant share. According to MBA and MMG Real Estate Advisors, multifamily loan maturities jump from approximately $104.1 billion in 2025 to $162.1 billion in 2026 — a 56% increase — and edge up to $167.7 billion in 2027. Distressed apartment sales tracked by MSCI rose from $1.1 billion in early 2020 to $13.8 billion by June 2025.
Most of these loans were originated at 3%–4% in the mid-2010s. Borrowers refinancing today face rates that are nearly double, combined with more conservative loan-to-value underwriting. The result: even performing properties often need fresh equity to refinance.
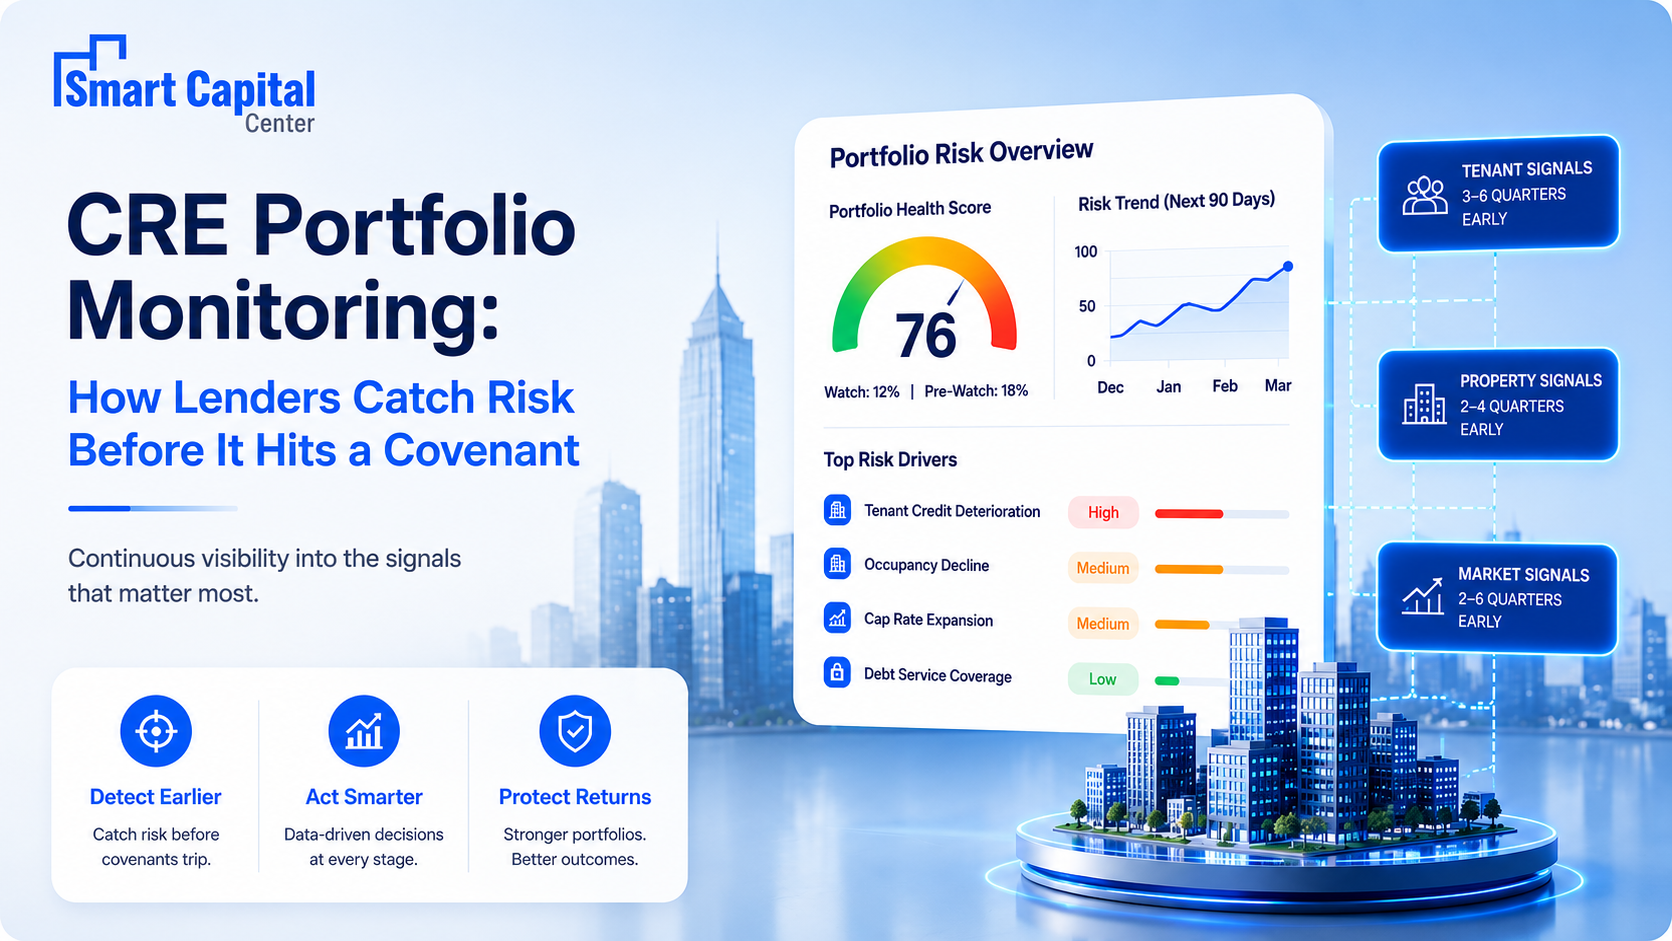
This is precisely where Smart Capital Center's debt management capability is engineered to operate. The platform monitors loan covenants, refinance triggers, and lender pricing across portfolios in real time — flagging recapitalization opportunities and stress points well before maturity dates.

The Bay Area's economic landscape has shown resilience amidst recurring challenges over the decades. Historical headlines have often heralded doom during downturns—recessions hitting Silicon Valley and economic slowdowns in San Francisco—but the region has invariably bounced back.
The Bay Area's cyclical nature, characterized by its "ups and downs," has not hindered its long-term growth and success. Despite the headwinds it has faced over the past 20 to 30 years, the Bay Area consistently emerges stronger, and current signs point towards an even more favorable positioning compared to other markets.

The Bay Area's slower post-pandemic recovery has aged well. While Sun Belt markets are working through 9%+ vacancies, San Jose, San Francisco, and Oakland are operating at vacancy rates of roughly 1–2% of housing stock additions — among the most disciplined in the country.
The economic engine underneath that supply restraint is now AI. The Bay Area is projected to capture roughly a quarter of all AI jobs in the United States, according to JLL research, and California recorded 220,000+ new business applications in 2023 — a 35% increase over 2017 levels. Tech-sector hiring has stabilized, and AI infrastructure investment is now the dominant driver of office and data-center demand in the region.
For multifamily owners in Northern California, the result is a unique combination: tight supply, high household income (projected to run 55% above the U.S. average by 2030 per Bay Area Council Economic Institute analysis), and a renter base anchored by some of the highest-paying jobs in the country.

Despite the supply correction, multifamily remains the most resilient major property type. According to Arbor's February 2026 multifamily snapshot, 2025 apartment investment volume reached $165.5 billion — the second consecutive year of expansion and 9.4% above 2024. Cap rates averaged 5.7%, the tightest of any major property type. Effective rents remain 25% above pre-pandemic levels even after a soft 2025.
Multifamily values declined 4% in 2025 versus 2024 and sit roughly 28% below the 2022 peak — but they are still 8% above 2019 levels, according to Cotality. Delinquency rates are rising, but remain materially below office.
"We're past the peak of a multifamily construction surge, but a healthy supply of new units is still hitting the market and colliding with sluggish demand, causing vacancies to continue trending up." — Molly Boesel, Senior Principal Economist, Cotality
The signal for investors: this is a buyer's window in selected metros, particularly supply-constrained coastal markets and Midwest cities with smaller construction pipelines. The 2017–2018 transaction velocity is returning, and well-capitalized investors are positioning for the 2027–2028 supply trough.
Smart Capital Center is an AI-powered underwriting, portfolio insight, and debt management platform used by KeyBank, JLL, RGA, Pacific Life, The RMR Group, and other leading institutional investors and lenders. The platform was named a GlobeSt Influencer in CRE Technology in both 2024 and 2026.
For multifamily investors operating in the current environment, the platform delivers three concrete advantages:
For a deeper look at how the platform is applied, see our recap of MBA CREF 2024 takeaways and our two-part series on the future role of generative AI in CRE lending.

What is the current U.S. apartment vacancy rate in 2026?
National multifamily vacancy is between 7.3% and 9.4% as of early 2026, depending on the data set. Cotality reported a record 7.3% rate in December 2025, while Cushman & Wakefield's Q1 2026 MarketBeat puts the figure at 9.4%. The historical average is roughly 6.9%, so the market is materially above norm — though stabilizing as new supply slows.
Which multifamily markets have the highest vacancy in 2026?
According to ApartmentList and Tactica RES data, the highest-vacancy metros in early 2026 are Cape Coral and Naples, FL (11.3%), Colorado Springs (10.2%), Austin (9.7%), San Antonio (9.5%), Boulder (9.2%), and Dallas–Fort Worth (9.0%). All have heavy Sun Belt or Mountain West construction pipelines that are still delivering into softening demand.
How big is the 2026 CRE refinancing wall?
Total CRE loan maturities through 2026 are projected to exceed $1.5 trillion, with some estimates as high as $1.8 trillion, according to MMG Real Estate Advisors and MBA data. Multifamily-specific maturities jump 56% from $104.1 billion in 2025 to $162.1 billion in 2026 and rise further to $167.7 billion in 2027.
Are multifamily cap rates rising or compressing in 2026?
Average 2025 apartment cap rates were 5.7%, unchanged from 2024 and the tightest of any major property type, according to MSCI Real Capital Analytics data published by Arbor. Cap rates have remained relatively stable as institutional capital continues to favor multifamily over office and retail, though Sun Belt cap rates have begun to widen modestly to reflect supply risk.
Is the Bay Area still a strong multifamily market in 2026?
Yes — for supply-constrained reasons. Bay Area metros added housing stock at roughly 1–2% during the boom cycle, far below the 6%–9% rates seen in Austin, Charlotte, and Nashville. Combined with the region's projected capture of ~25% of U.S. AI jobs and household income running 55% above the national average, Bay Area multifamily is positioned for outperformance as the broader market exits the supply correction.
When will the multifamily supply correction end?
NAHB projects multifamily starts will decline 5% in 2026 to 392,000 units and another 6% in 2027 to 367,000 — the lowest level since 2016, per Cushman & Wakefield Q1 2026. With the typical 18–30 month delivery lag, that means the 2027–2028 vintage will be supply-starved in most metros, setting up rent growth for owners who hold occupancy through 2026.
How does Smart Capital Center help investors navigate the multifamily cycle?
Smart Capital Center provides AI-powered underwriting, portfolio insight, and debt management for institutional and private investors. The platform analyzes 1B+ real-time data points across 120M+ properties, has supported $500B+ in CRE transactions, and integrates with Yardi, ARGUS, SS&C Precision, and Midland Enterprise via API. Book a demo to apply it to your portfolio.


.png)