CRE Investors
July 16, 2026
CRE Investors
July 16, 2026

According to Deloitte's 2026 Commercial Real Estate Outlook, the majority of global CRE leaders identify data fragmentation and reporting lag as the largest barrier to faster portfolio decisions. Commercial real estate investors are not short on numbers — rent rolls, occupancy rates, expense reports, and lease expirations all flow in by the hour. The bottleneck is converting that data into a unified, current view of the portfolio fast enough to act on it.
Real estate firms that adopt a comprehensive CRE portfolio reporting tool see decision-making speed improve by up to 40% while reducing errors in financial reporting, according to JLL's Global Real Estate Technology Report (2025). The lift comes from one structural change: replacing manual consolidation with continuously-updated dashboards that turn raw data into machine-readable, comparable insights.
Smart Capital Center — used by JLL, KeyBank, The RMR Group, and Tremont Realty Capital — pushes this further with AI-powered reporting and 24/7 portfolio monitoring. The platform's AI agents collapsed financial statement processing time at JLL from 30–40 minutes to 1–3 minutes per statement (a 30x productivity gain), and KeyBank reported a 40% time reduction in financial model preparation midway through implementation.
Many commercial real estate investors still rely on manual processes cobbled together from multiple sources. Property managers send monthly reports in various formats. Accounting systems track financial performance. Separate spreadsheets monitor lease expirations. Market data comes from yet another source — typically CoStar, Yardi Matrix, or REIS. Consolidating this information into coherent portfolio views consumes 5–10 business days per month for institutional teams, according to the Altus Group CRE Industry Conditions Survey (Q1 2026).
Beyond the time burden, manual reporting introduces errors at every handoff. Data gets transcribed incorrectly. Formulas break when spreadsheets are updated. Inconsistent methodologies across properties make comparisons unreliable. By the time reports are compiled, the information may already be two to four weeks stale — a window long enough for a covenant to trip, a tenant to default, or a competing fund to win the next acquisition.
These problems multiply as portfolios grow. Managing reporting for three properties manually is tedious but manageable. Attempting the same approach with fifteen or thirty properties becomes untenable, leading to incomplete analysis or delayed decisions that miss market opportunities.
Smart Capital Center's AI-powered data extraction automatically processes rent rolls, T-12s, financial statements, and lease documents — reducing processing time from 30–40 minutes to 1–3 minutes per financial statement, a 90% reduction proven with JLL. The platform's live API integrations with Yardi, SS&C Precision, Midland Enterprise, and PNC Enterprise mean data flows automatically from property management and accounting systems without manual entry, eliminating the transcription errors that plague traditional reporting.
A CRE portfolio reporting tool is software that ingests data from property management, accounting, lease administration, and market data systems and presents it as a unified set of dashboards and reports for an entire commercial real estate portfolio. These platforms connect to multiple data sources — property management systems, accounting software, market databases, banking systems — and automatically compile the information into standardized, queryable formats.
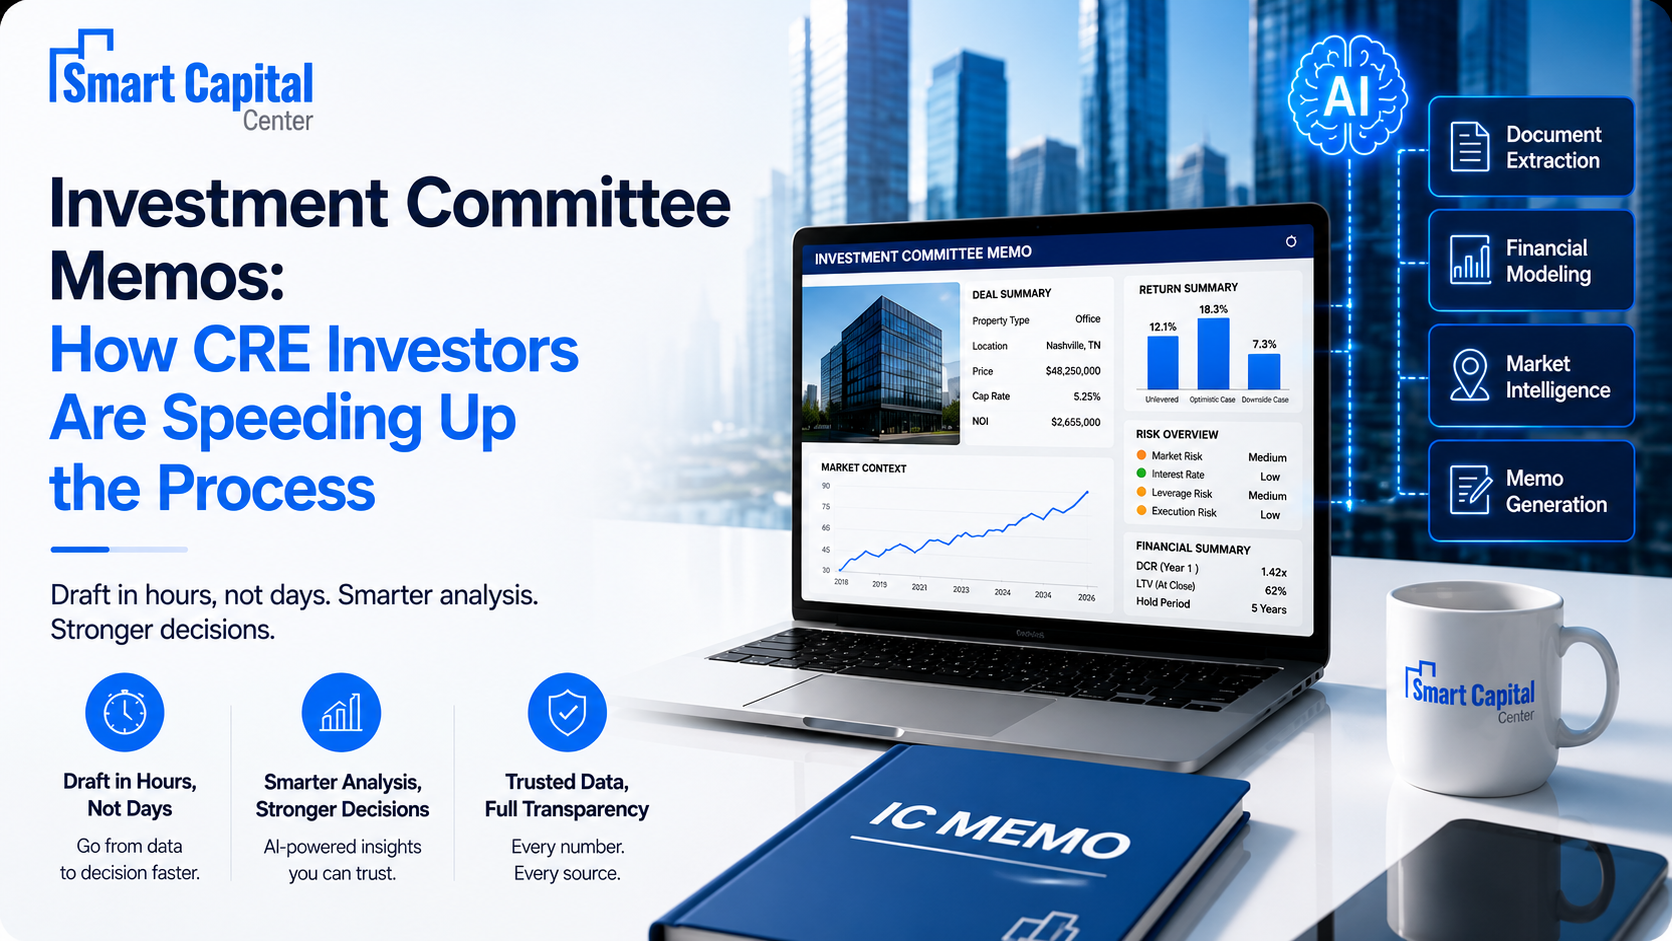
The best CRE portfolio reporting tools do four things: (1) automate data extraction from rent rolls, T-12s, and financial statements; (2) normalize that data across properties and time periods; (3) calculate portfolio-level KPIs — NOI growth, DSCR, occupancy, cash-on-cash return — without manual reconciliation; and (4) generate stakeholder-ready outputs (board decks, LP letters, lender reports) without rework.
Modern CRE investor reporting software is not just look-back. It manages the portfolio proactively: flagging exceptions, benchmarking against market comps in real time, and identifying patterns before they impact performance. Instead of spending time compiling data, investors spend time analyzing it and making strategic decisions.

The most immediate benefit comes from automation. Tasks that previously required days of manual work happen automatically. Data flows from source systems into reporting platforms without manual entry. Reports are generated with a few clicks rather than hours of spreadsheet manipulation.
This efficiency allows portfolio managers to focus on analysis and strategy rather than data wrangling. Time previously spent on administrative reporting tasks can be redirected toward identifying opportunities, addressing problems, and improving property performance.
Smart Capital Center's automation delivers quantified results. JLL's Director of Asset Management reported a 30x productivity gain—what took 30-40 minutes now takes 1-3 minutes. KeyBank achieved a 40% time reduction in preparing financial models, and they were only midway through implementation. A Credit Risk Manager at a leading US insurance company said Smart Capital Center removed most manual work. This let the team focus on more productive, higher-level tasks. They also received results much faster.
Automated data integration eliminates transcription errors that plague manual processes. When systems connect directly, numbers flow from source to report without human intervention. Mistakes occur. Formula errors disappear when calculations are standardized and validated within the reporting platform.
Improved accuracy means more confident decision-making. Investors can trust the numbers they're seeing and act decisively rather than second-guessing data quality.
Smart Capital Center's AI-powered data extraction doesn't just automate—it validates. The system includes AI-powered validation and exception management that flags inconsistencies and potential errors automatically. When processing offering memorandums, rent rolls, or financial statements, the platform’s AI agents compare data across documents. They spot discrepancies that manual review might miss.
Smart Capital Center helps commercial mortgage lenders make decisions.
A Chief Risk Officer said these decisions are more objective and based on data. It boosts confidence in decision-making and helps reduce risk exposure. This confidence stems directly from knowing the underlying data is accurate, complete, and current.
Traditional reporting operates on monthly cycles, meaning portfolio insights are always at least three weeks old. A CRE portfolio reporting tool provides current visibility — as transactions occur and data updates in source systems, dashboards reflect those changes within hours.
Real-time visibility enables faster responses to emerging issues. A sudden vacancy can be addressed immediately rather than discovered at month-end. Lease renewals that require attention surface automatically instead of appearing during quarterly reviews.
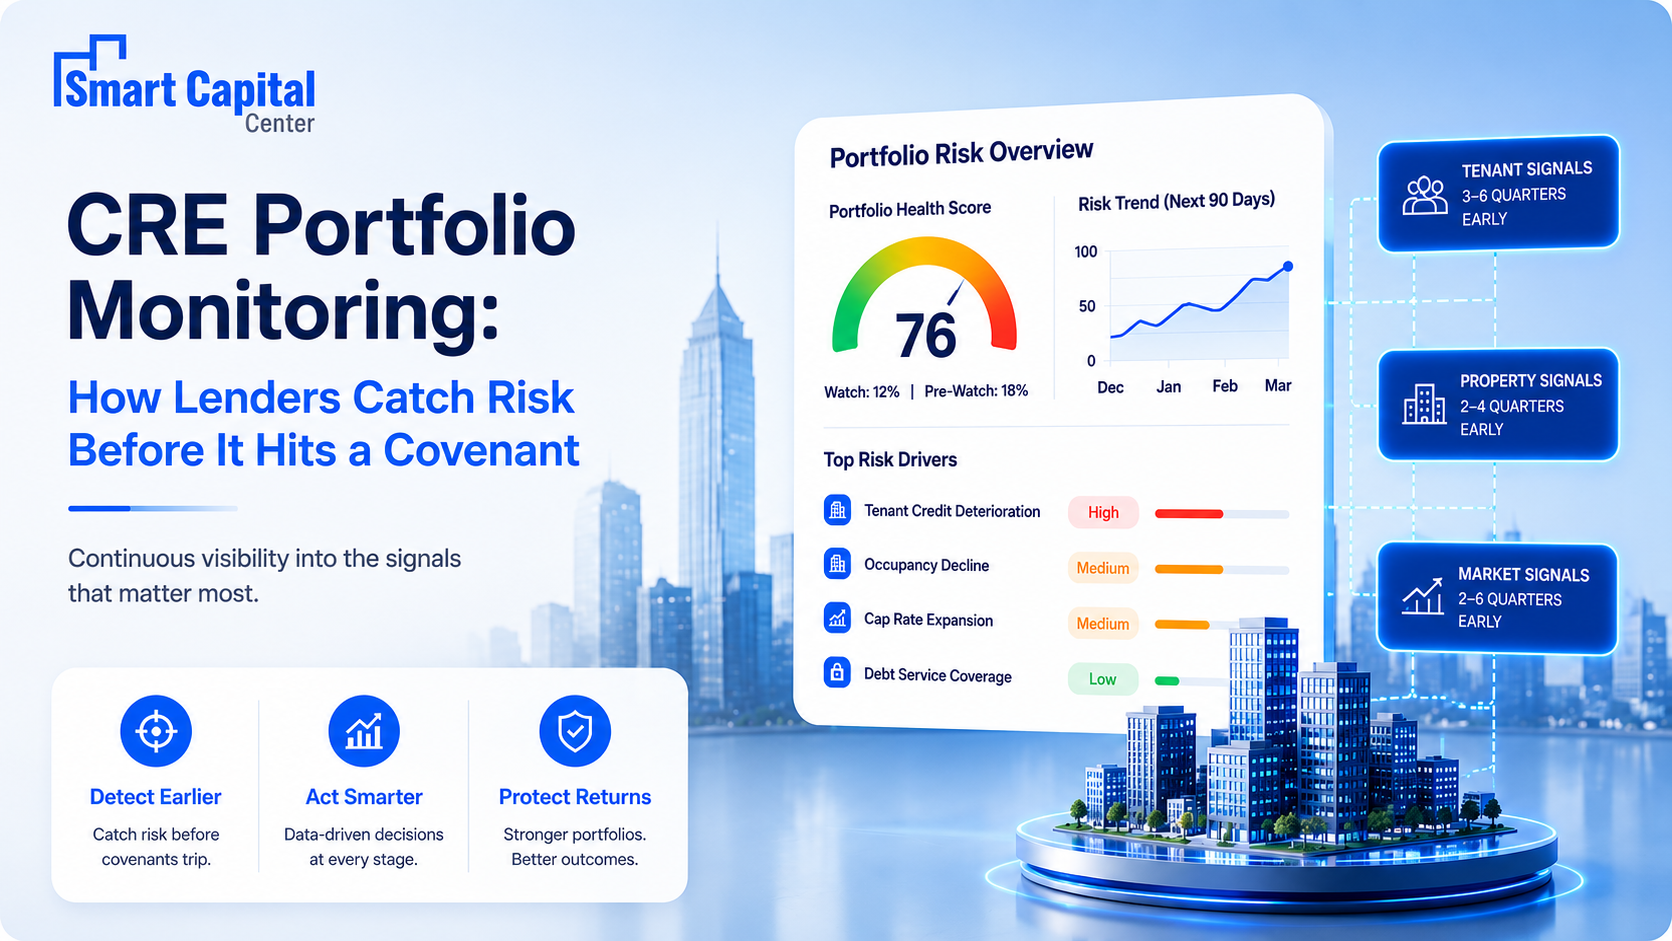
Smart Capital Center's 24/7 AI agents provide continuous portfolio monitoring with live dashboards that update as rent rolls and financials change. The platform's automated alerts notify investors immediately when critical metrics shift: DSCR drops, rising vacancy rates, covenant compliance issues. The system's predictive insights identify trends before they impact performance, giving investors time to take preventive action.
Reporting becomes dramatically more insightful when all properties can be viewed together in consistent formats. Side-by-side comparisons reveal which properties outperform or underperform. Examining the portfolio as a whole reveals trends that property-by-property analysis misses.
Comprehensive views also enable strategic planning. Investors can evaluate portfolio composition, identify concentration risks, and spot diversification opportunities when all holdings are visible in unified dashboards.
Smart Capital Center's portfolio analytics deliver this through AI agents that analyze every property continuously. The system benchmarks each property in real time against portfolio averages and market standards drawn from 120M+ properties — instantly showing which assets excel and which need attention. The platform's 360° view covers both debt and equity, helping investors see how their portfolio performs and how it compares to market opportunities.

Not all reporting tools offer the same capabilities. Four features separate platforms that earn their budget from those that become shelfware.
The foundation of any effective reporting tool is its ability to connect with existing systems. Integration depth determines whether a platform delivers a unified view or becomes another silo. Look for platforms that integrate with:
Critical distinction: API-level integrations refresh in minutes; file-import integrations refresh in days. The first delivers portfolio intelligence. The second is just faster manual reporting.
Different stakeholders need different information. Property managers focus on operational metrics like occupancy and maintenance costs. Financial officers care about cash flow and debt service coverage. Investors want to see returns and property valuations.
Effective CRE portfolio reporting tools allow customization so each user sees the metrics most relevant to their role. Customizable dashboards prevent information overload while ensuring everyone accesses the data they need.
Strong reporting platforms come with pre-built KPI tracking for metrics that matter in commercial real estate:
Visual KPI displays with trend lines and benchmarks make it easy to spot problems or opportunities at a glance.
Beyond dashboards for internal use, portfolio reporting tools should generate polished reports for external stakeholders. Investors, lenders, and partners need regular updates on portfolio performance. Creating these reports manually is time-consuming and difficult to standardize.
Look for tools with customizable report templates. Choose tools that automate report creation and sharing. They should support PDF and Excel outputs. They should also compare past results to show performance over time.
Implementing software does not guarantee better insights. Maximizing value requires deliberate deployment in four phases.
The quality of reporting outputs depends entirely on input data quality. Before implementation, clean up existing data: standardize property names and codes, verify tenant information, reconcile financial records, correct address inconsistencies. Investing time in cleanup upfront prevents confusion once reporting tools go live, and makes integration smoother and faster.
Rather than tracking everything, identify the 8–15 metrics most critical for portfolio decisions: portfolio occupancy and trends, NOI by property, debt service coverage, upcoming lease expirations, capital expenditure needs, cash flow and distributions. Focus configuration on these priority indicators. This targeted approach ensures key information is readily accessible while preventing dashboard clutter that obscures important insights.
The most sophisticated reporting tools deliver no value if team members don't use them effectively. Invest in role-based training for everyone who interacts with the platform — analysts, asset managers, accounting, leadership. Ensure they understand how to access dashboards, generate reports, interpret visualizations, and troubleshoot. Schedule quarterly refreshers to keep teams current as platform capabilities expand.
Set specific cadences for reviewing portfolio reports: weekly operational reviews focused on occupancy changes and immediate issues; monthly meetings examining financial performance against budget; quarterly sessions evaluating strategic positioning and long-term trends. Regular cadences ensure reporting tools drive actual decision-making rather than generating dashboards that go unused.
A note on deployment risk: any new platform introduces change-management friction, integration depth gaps, and validation period requirements. Plan a 60–90 day overlap where manual and automated reporting run side-by-side, document every variance, and require API-level (not file-based) integrations for accounting and PMS before scaling beyond pilot.
The comparison makes clear why automated reporting represents a significant competitive advantage, particularly as portfolios expand and complexity increases.
Commercial real estate success increasingly depends on making faster, better-informed decisions than competitors — and a CRE portfolio reporting tool is the operating layer that makes that speed possible. The benefits extend beyond efficiency: improved accuracy, real-time visibility, comprehensive portfolio views, and scalability all contribute to stronger performance and lower risk exposure. The decision is no longer whether to automate portfolio reporting; it is which platform consolidates your existing stack without forcing a rip-and-replace.
Trusted by JLL, KeyBank, The RMR Group, and Tremont Realty Capital, and recognized with the GlobeSt 2024 Influencer in CRE Technology Award, Smart Capital Center gives institutional teams the same intelligence infrastructure used by the largest CRE platforms — informed by $500B+ in analyzed transactions across 120M+ properties.
See how Smart Capital Center eliminates reporting lag across your full portfolio. Book a demo today.
Property management software like Yardi, MRI, or AppFolio runs day-to-day property operations: leases, work orders, tenant ledgers, AR. A CRE portfolio reporting tool sits a layer above PMS, ingesting data from PMS along with accounting, market data, and lease admin systems to produce portfolio-level intelligence. The two are complementary, not competing — and the best reporting tools integrate directly with the leading PMS platforms rather than trying to replace them.
For institutional portfolios, expect 30–90 days for a phased rollout: 30 days to integrate primary data sources, another 30 to validate output against existing reports, and 30 more for full team adoption. KeyBank reported a 40% reduction in financial model preparation time midway through implementation — meaningful value before the rollout was fully complete.
At minimum: a property management system (Yardi, MRI, RealPage), a general ledger system (SS&C Precision, Sage Intacct, MRI Accounting), a lease administration platform, and at least one market data provider (CoStar, Yardi Matrix, or REIS). For lenders, banking integrations like PNC Enterprise and Midland Enterprise are critical. Avoid platforms that rely on file uploads instead of API connections — file-based integrations cap your refresh cycle at days, not hours.
AI improves CRE reporting in three specific ways: extraction (turning PDF rent rolls and scanned T-12s into structured data in minutes instead of hours), validation (flagging inconsistencies across documents that manual review misses), and prediction (surfacing covenant, vacancy, and DSCR risks before they become incidents). Smart Capital Center's 24/7 AI agents apply all three across portfolios, monitoring 1B+ data points continuously to give institutional teams forward-looking risk visibility instead of look-back reporting.
Yes — and the math is more favorable for small teams than large ones, because automation replaces headcount they cannot otherwise afford. A team of three analysts running 10–15 properties manually spends roughly the same hours per property as a team of fifteen running 100 properties; automating that floor unlocks deal capacity without hiring. Cross-property benchmarking against 120M+ properties also closes the institutional data gap that historically priced smaller investors out of competitive markets.

.png)